Luck Favors the Prepared: Heterogeneity in Stress-Induced Adaptive Capacity Depends on Stress Parameters
M. Knafo, S. Rezenman, I. Tsigalnitski, R. Nevo, Z. Reich and R. Kapon.
gUMI BEAR single cell barcoding video
In this study, we investigated the role of population heterogeneity in stress-induced adaptations and natural selection, focusing on the interplay between phenotypic variability and stress. We developed an experimental system, based on single-cell and population measurements in Saccharomyces cerevisiae, that evaluates the level of insult sustained by the population and the degree of phenotypic variability induced by the stressful challenge. Stress was induced by subjecting a population to four environmental stressors, each at multiple levels, and phenotypic variability was assessed by calculating the Shannon entropy of gene expression levels for 65 representative genes.
Our results indicate a link between previous exposure to stress and the complexity of the available adaptive avenues. We found that familiar stresses led to greater phenotypic variability, providing a platform for multiple solutions with different fitness levels, while unusual stresses resulted in a limited number of generic solutions with similar fitness levels. To corroborate our hypothesis, we used our single-cell barcoding technique to follow tens of thousands of lineage trajectories upon acute stress induction. Our single-cell barcoding technique revealed that when yeast populations had prior experience with a stressor, fitness biases emerged between lineages in real-time; in contrast, non-biased selection occurred when the stressor was unfamiliar.
Our findings suggest that, upon repeated exposure, populations develop robust and redundant stress responses, whereas untrained populations rely on generic stress-alleviating mechanisms. This indicates that yeast populations can elicit novel and creative adaptations when challenged by familiar stressors.
Stress and Variability Quantification
Organisms like yeast sometimes encounter environmental stressors for which they have no immediate, existing solution, leading to a decrease in fitness and reproductive capabilities.
To combat these stressors, yeast populations utilize standing variation or increase their phenotypic variability, enabling the exploration of various potential solutions or alternative paths to the same solution. This variability is driven by changes in gene expression rather than changes in the genes themselves.
The extent of this phenotypic variability and exploration is enhanced by previous encounters with similar stressors. Each past encounter increases stress-induced variability, preparing the yeast population to handle different levels or types of the same stressor more effectively.
Once one or more viable solutions to a particular stressor are identified, the population reduces its phenotypic variability. The organisms begin to exploit it, decreasing the need for further phenotypic exploration.
Bottom: experimental design in which cells are exposed to multiple levels of stress (leftmost) and insult parameters (Lag time, CFU number), as well as variability (entropy of single-cell fluorescence) (FACS), are calculated for A - NaCl, B - Hydrogen peroxide, C - Temperature, and D - pH. The insult to the population is quantified by CFU on plates (pink) and recovery time after exposure (green). Membrane integrity (pink) is plotted as the intensity of the background. Variability quantified in terms of Shannon entropy for each gene is shown in gray, with values significantly different than basal marked with *.
From left to right:
Comparison of the distribution of expression of two genes. Shown are ridge plots of the distributions of expression of two genes, Jen1 (left) and Hsp42 (right), each measured in three replicates (A, purple, B orange, and C red) at five different temperatures. Hsp42 presents a unimodal distribution that shifts with temperature while remaining relatively narrow up until 49C, whereas Jen1’s expression becomes multi-modal at some temperatures.
65 selected genes that recapitulate the proteomic trend as described in Newman et al. 2006. Purple is original data; orange is selected genes. The blue line is the regression trend of the original data, and the red line is the regression trend for the selected genes.
Compression to previously released data.
Measurements made us construct a working hypothesis that integrates the history of stress exposure and the machinery available to deal with the environmental insult:
Top: Historical exposures to a given stress. Top-exotic stress with few past exposures in which the population survives via natural selection, but no optimized phenotypes arise. Bottom–familiar stress encountered numerous times throughout evolutionary history. The repeated cycle of exposure results in a highly optimized strain capable of a robust stress response.
Bottom: A cell presenting a multi-faceted phenotype able to utilize multiple adaptive avenues results in an array of phenotypes upon stress induction vs. a population presenting multiple enduring phenotypes selected from upon stress induction.
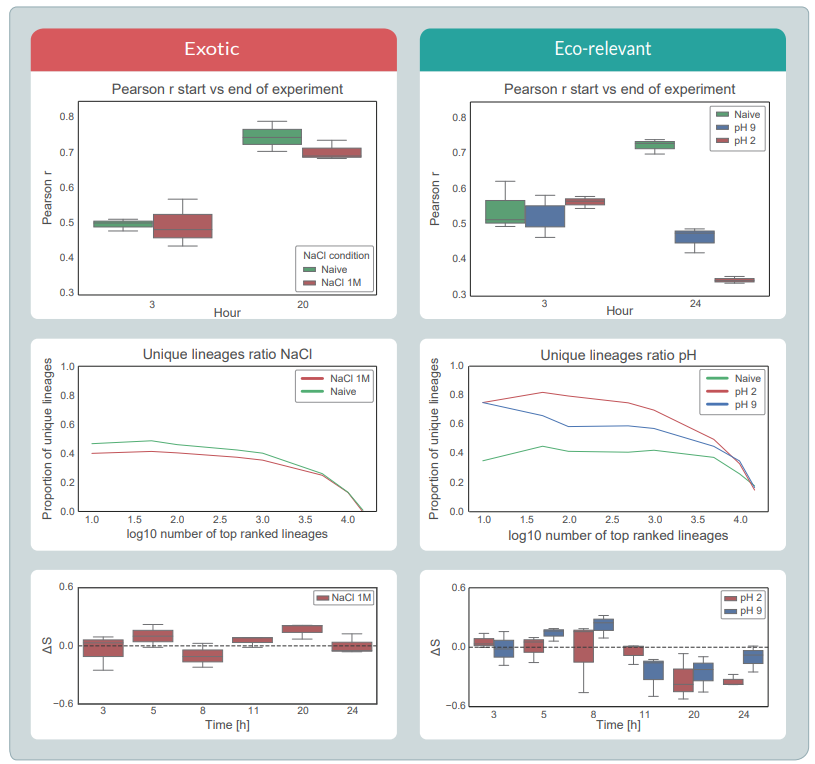
Propagation of adaptive strategies in multi lineages measurements
Left- NaCl challenge, described here as exotic stress. Right-pH challenge, which we describe here as Eco-relevant stress. Top - Pearson correlation between biological replicates at the beginning and end of the experiment. Green is unchallenged, and red and blue indicate a challenge. After eight hours, different lineages take over the population in different repeats for pH 2 and pH 9, whereas NaCl and unchallenged populations behave the same in all repeats. Middle - Proportion of lineages that are unique to a repeat for increasing numbers of top-ranked lineages. The number of unique lineages rises in pH stress demonstrating that different lineages find solutions in each repeat, implying that the solutions arose post-exposure. Bottom - Change in entropy (ΔS) between challenged and unchallenged replicates as a function of time shows that pH challenges induce a change in the distribution of lineages that NaCl does not.
Top - Exotic environmental stress with a strong selection coefficient challenges cells. Colors indicate different lineages in the population. A random phenotype (1 protein) is preadapted and distributed in the population—selection results in the same distribution of lineages having the same phenotype. Bottom - Cells face a familiar stressor and rely on many survival mechanisms. A single adaptation of pre-existing mechanism arises (yellow protein is more highly expressed), resulting in differential growth.


